| 1. Number of paid mobile app downloads worldwide | |
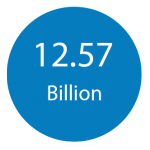 |
In 2015
Source : Statista |
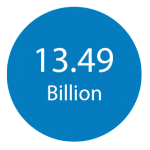 |
In 2016
Source : Statista |
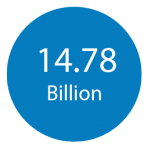 |
In 2017
Source : Statista |
| 2. Number of free mobile app downloads worldwide | |
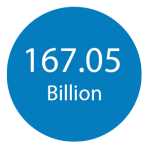 |
In 2015
Source : Statista |
 |
In 2016
Source : Statista |
 |
In 2017
Source : Statista |
| 3. Most commonly used user acquisition methods/Common methods of App promotion | |
 |
(a) App Cross Promotions-Own Apps
Source : VB Insights |
|
(b) App Cross Promotions-Partnership Ads
Source : VB Insights |
 |
(c) App Cross Promotion- SEO
Source : VB Insights |
 |
(d) Banner Ads In Mobile Ads
Source : VB Insights |
 |
(e) Email Campaigns
Source : VB Insights |
 |
(f) Native Ads
Source : VB Insights |
 |
(g) PR, Press
Source : VB Insights |
 |
(h) Interstitial Ads
Source : VB Insights |
 |
(i) Inbound Marketing
Source : VB Insights |
 |
(j) Incentivized Installs
Source : VB Insights |
 |
(k) In-app Viral Tactics
Source : VB Insights |
 |
(l) Social Campaigns
Source : VB Insights |
 |
(m) Video Ads
Source : VB Insights |
 |
(n) Web Organic Search
Source : VB Insights |
 |
(o) Others
Source : VB Insights |
| 4. Advertising investment in Mobile App | |
 |
(a) US app install ad spending is expected to reach.
Source : Emarketer |
 |
(b) Of US mobile display, this year the ad spending app install ads will account
Source : Emarketer |
| 5. Ranking App Store categories as per the investment they are drawing in user acquisition- (Q1 – 2015) | |
 |
(a) Games
Source : AppAnnie |
 |
(b) Photos &Amp; Videos
Source : AppAnnie |
 |
(c) Entertainment
Source : AppAnnie |
 |
(d) Social Networking
Source : AppAnnie |
|
(e) Lifestyle
Source : AppAnnie |
| 6. Ranking Play Store categories as per the investment they are drawing in user acquisition- (Q1 – 2015) | |
 |
(a) Games
Source : AppAnnie |
 |
(b) Tools
Source : AppAnnie |
 |
(c) Communication
Source : AppAnnie |
 |
(d) Photography
Source : AppAnnie |
|
(e) Entertainment
Source : AppAnnie |
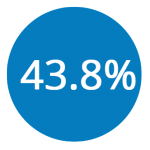
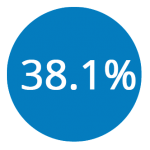
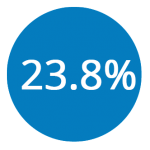
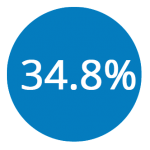
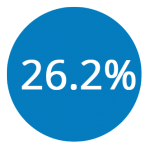
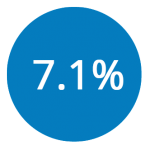
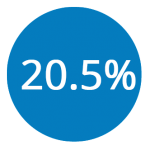
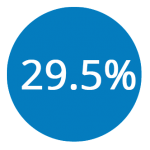
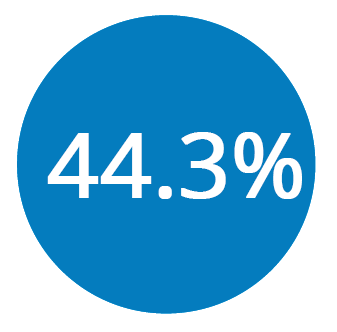
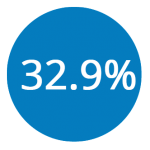
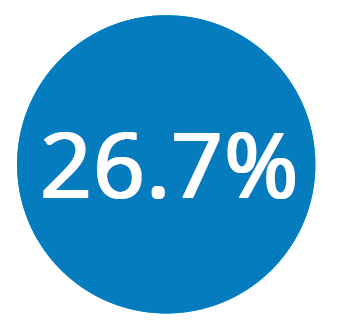
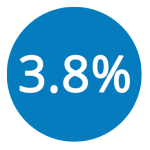
| 7. Retention Rates in Mobile App | |
 |
Improvement in App retention over the past four years, with apps used just once declining to 20%.
Source : Localytics |
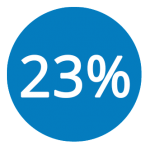
 |
Of apps are now used 11 times or more, an improvement of 13% over the same period.
Source : AppAnnie |
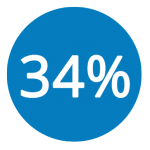 |
Android has overtaken iOS with the percentage of apps used 11 times or more rising to 45% compared to iOS, which remained at
Source : AppAnnie |
 |
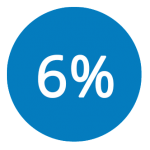
Of iOS apps are only opened once, whereas this applies to just 16% of Android apps.
Source : AppAnnie |
 |
Of app time by an average user is spent in 3 most frequently used apps.
Source : AppAnnie |
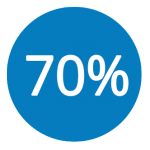
 |
Of the app users loose half of their peak users in 3 months.
Source : AppAnnie |
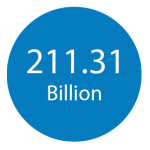
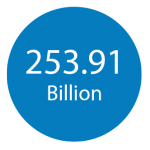
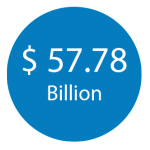
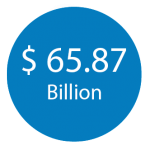
| 8. Projection on growth of Mobile Ad Spend ( In $) | |
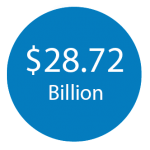 |
In 2015
Source : Emarketer |
 |
In 2016
Source : Emarketer |
 |
In 2017
Source : Emarketer |
 |
In 2018
Source : Emarketer |
 |
In 2019
Source : Emarketer |
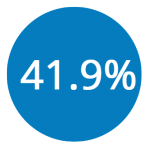
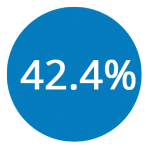
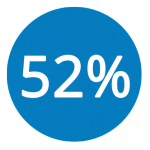
| 9. Projection on growth of Mobile Ad Spend ( In %) | |
 |
In 2015
Source : Emarketer |
|
In 2016
Source : Emarketer |
 |
In 2017
Source : Emarketer |
 |
In 2018
Source : Emarketer |
 |
In 2019
Source : Emarketer |
Back to Blog
July 14, 2015By [x]cube LABS